Wireshark
Retrospective Analysis
All of the functions that I have looked at thus far relate mainly to capturing the data that you want to investigate. Filters are mainly used to restrict the anticipated data volume, but they can also restrict the investigation to possibly suspicious ports or protocols.
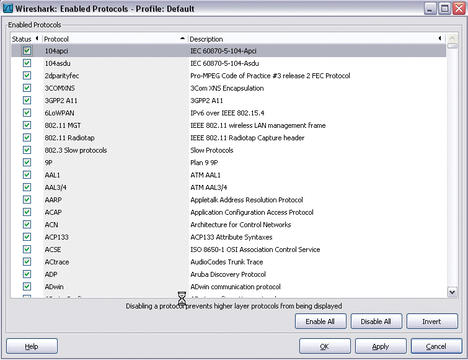
Additionally, Wireshark offers an impressive range of analysis functions in the Analyze menu. Besides using the toolbar to create display filters, you can also target and disable individual protocols here (Figure 7).
 Figure 7: Wireshark supports a huge range of critical protocols that the administrator can use to filter data.
The Analyze | Expert Infos option is very powerful and useful; it provides an overview of the selected protocol sequence from which you can glean useful information for troubleshooting (Figure 8).
For example, if you want to follow the details of an authentication handshake, Wireshark offers you a stream trace function in Analyze | Follow TCP Stream (alternatively, Follow UDP Stream and Follow SSL Stream ). I’ll look at an example of an SSH login to illustrate this. To begin, you need to enable an SSH server on a second machine and then run Wireshark on the first machine and initiate an SSH login. Before doing so, you need to configure Wireshark to use a protocol filter that only records the packets belonging to an SSH session. To do so, you need to restrict the capture to the SSH protocol using either capture or display filters. The capture filter would look like this:
port 22
Then start capturing, initiate an SSH login at the console, and in the Analyze menu, select Follow TCP Stream . The result should look something like Figure 9 (see also “Colors” box).
Because SSH connections are encrypted, a hacker will not be able to glean any useful information by deploying Wireshark. However, the example shows you how easily you could use the Follow TCP Stream to sniff a telnet login, for example, or – if you want something more up to date – an HTTP login that is not secured by SSL (see “Legal Note” box).
Statistics
Wireshark’s Statistics menu also offers useful statistics functions for IP addresses, packet lengths, protocol types, communication endpoints, conversations, service response times, and many other things.
The Statistics | UDP Multicast-Streams is both interesting and useful. If you suspect VoIP problems, or experience issues with Internet-based voice transmissions, you should check out the Telephony menu. It gives you a fast option for filtering data traffic for telephony data analysis purposes for both the signaling traffic (SIP) and the voice traffic (RTP) on UDP. With the Telephony | SIP … and Telephony | RTP menu items, you can easily create matching filters and generate statistics, a particularly powerful function. Telephony | RTP | Show All Streams quickly filters and visualizes all existing RTP streams. RTP stream analysis in Telephony | SIP | Stream Analysis then generates statistics for the selected RTP stream, including the arrival time of the packet, the delay, and the jitter.


