Wireshark
Wireshark Hands-On
The results window will mainly show you frequently recurring packets that belong to the same protocol group, such as Cups broadcasts, IGMP packets, DHCP requests, or ARP requests, which the network interfaces use to discover the IP address belongs to a MAC address. Additionally, routers or switches exchange information, and Samba or Windows hosts distribute browsing messages on the network; all of these things can be seen as normal network traffic.
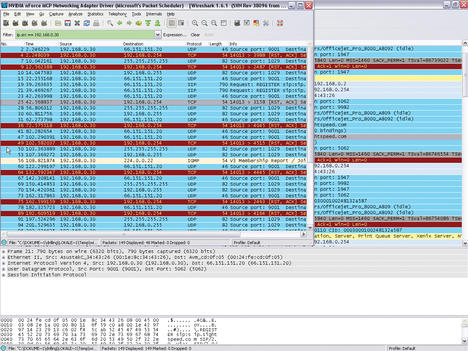
In this simple example, notice that the local host with the IP address 192.168.0.30 has sent SIP packets to the target 66.151.151.20. Because Internet telephony is not used on this machine, this activity is well worth investigating. Double-clicking the packet opens a new Wireshark window with a detailed view; its title comprises the source IP, target IP, protocol, and an info text.
The info column in the list view states that SIP requests are addressed to the website at sip.sightspeed.com . Clicking the + in the detail window for Session Initiation Protocol confirms this fact. Back in the main window, right-click the offending packet and select Apply as Filter in the drop-down menu to create a display filter. To investigate all of the packets here, the Selected menu item is the correct choice. Wireshark shows you the syntax of the display filter you created in the line that appears highlighted in green.
 Figure 4: Reduce the data volume by defining a filter that tells Wireshark to capture only the packets to or from a particular interface.
ip.src == 192.168.0.30
Next, press Apply to tell Wireshark to display the packets to or from this particular machine (Figure 4).
The sip.sightspeed.com service is run by Logitech, and after further investigation you can see that the user of this workstation installed a webcam some time in the past with Logitech’s own video telephony solution (Vid HD), which is used by the US VoIP provider Sightspeed. On the subject of VoIP, note that Wireshark offers a number of powerful functions and filters expressly for analyzing telephony problems in the Telephony menu.
Using Filters
If you don’t use any filters, Wireshark will capture the complete data traffic and present all of the packets required by the daily management of the network as the results, including ARP requests, NetBIOS and Cups broadcasts, and IGMP and STP (Spanning Tree Protocol) packets. In terms of network analysis, packets of this kind are typically irrelevant, unless you suspect an ARP poisoning attack. Thus, you should apply a capture filter to remove these packets while recording the results. Again, you need to open the Capture | Options dialog and enter a capture filter that uses libpcap syntax to the right of the Capture-Filter button.
The entry
host IP address
restricts the data volume to packets sent or received by the host with the specified IP address (Figure 5).
If you want to exclude the management packets described above, you can do something like this:
host IP address and not arp and not igmp
Many other useful practical examples of capture filters and display filters are available from the Wireshark wiki. Despite a relatively easy-to-understand and well-documented syntax, creating filters is a complex affair. Wireshark helps with a filter Toolbar in the Analyze | Display Filters menu.
In addition to selecting a number of predefined display filters, you can press the New button to enter filter expressions directly. Clicking the Expression filter lets you compile the required filter in a dialog (Figure 6).
Although a similar function for capturing filters is accessible via the menu entry Capture | Capture-Filters , it does not give you an Expression button.
The filter dialog doesn’t just show the available protocol fields, but also displays the operators that you can use with the protocol in question in the Relation column. Experienced administrators will be able to combine these to create individual expressions.
When you’re done, press OK to transfer the expression to the filter list, then you can select the expression and press Apply .


