« Previous 1 2 3 4 Next »
Open source monitoring with Zabbix
A Clear View
Problem Detection
Just as flexible as the options for data collection are the functions for generating events from the acquired and historicized raw monitoring data, and thus for presenting problems.
The introduction of the new trigger expression syntax in Zabbix 5.4 is certainly the most important change in recent years. The manufacturer has changed the notation of expressions to a new format that should be easier to interpret and understand. Along with the new syntax came numerous new trigger functions [6], totaling about 100 mathematical, logical, string-based, iterator, and aggregation functions.
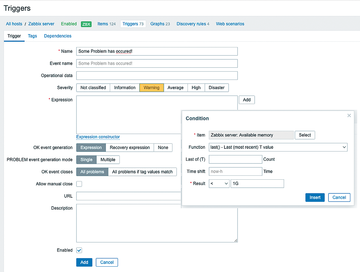
The multitude of available trigger functions might seem a bit confusing at first glance; however, with the graphical expression builder (Figure 7) and the Add button to the right of the trigger Expression window, it is very easy to create triggers. You simply select the item on the basis of which you want to set a trigger, then choose a suitable function, and parameterize it in line with the short description. Done.
Instead of storing threshold values in a fixed trigger definition, the use of user macros is recommended because they offer an additional customization option and are used to store trigger definitions in templates, which in turn can use multiple hosts (and even other templates). User macros can be assigned a default value, globally or in a template, that can be overwritten host by host. This capability allows individualized triggering per host and use case. A trigger expression could look like:
last(/Zabbix server/vm.memory.si
ze[available])<{$MEMORY_LOW}
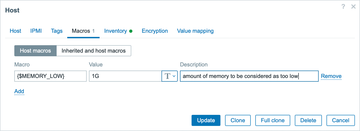
You then need to define the corresponding user macro for this trigger function as shown in Figure 8. You always need to specify the item referenced in a trigger definition with its item key. The key uniquely identifies each item on a host or in a template and can occur only once in the corresponding context.
Trigger
One big benefit in Zabbix is the metrics history, which is always available for trigger evaluation. You can minimize false positives by evaluating the history instead of individual measured values (i.e., monitoring alerts caused by conditions that occur for a short time but do not represent a malfunction). For example, a simple trigger expression such as
max(/<Host>/icmpping,3m)=0
could be used to respond only if a host has not been reachable by an ICMP ping for at least three minutes.
However, triggers can be much more complex. Combining multiple sub-expressions with advanced trigger functions lets you calculate changes in values over time or determine the direction and continuity of the change. You could even have evaluation functions that are based on machine learning that incorporate long-term data and implement prediction functions.
As an example of an extended trigger expression, I'll look at the trigger anchored in the supplied templates for low space on a filesystem. This example combines two definable thresholds. One relates to the utilization level as a percentage and the other to a fixed value for the remaining available space. It also has a prediction function:
last(/Linux filesystems by Zabbix agent/vfs.fs.size[{#FSNAME},pused])>{$VFS.FS.PUSED.MAX.WARN:"{#FSNAME}"} and ((last(/Linux filesystems by Zabbix agent/vfs.fs.size[{#FSNAME},total])-last(/Linux filesystems by Zabbix agent/vfs.fs.size[{#FSNAME},used]))<{$VFS.FS.FREE.MIN.WARN:"{#FSNAME}"} or timeleft(/Linux filesystems by Zabbix agent/vfs.fs.size[{#FSNAME},pused],1h,100)<1d)This trigger only fires when the percent threshold is exceeded but, at the same time, either the value drops below a fixed threshold in megabytes or the filesystem is less than one day away from becoming 100 percent full.
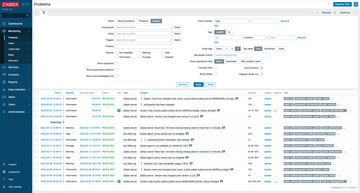
Users can view and edit the problems detected by the triggers on the Problems page of the user interface. You can filter by problem, item, host and template tags, host groups, problem and host names, and monitoring host meta-information. Filters can also be saved to ensure quick access at any time. You have several options for changing how the Problems page (Figure 9) displays. The popular Compact view gives you more space for the display.
On this page you can confirm problems to indicate to other administrators that work on a solution has already begun. Instead, you could simply add a comment and – depending on the user authorization – change the Severity of a problem. Custom commands in the context of problems make it possible, for example, to create an entry for a specific problem with a webhook in the ticket system.
A calculated item uses the trigger expressions as a formula for computation, just like the trigger definitions. In this way, you can use multiple trigger functions both to detect problems and to generate derived metrics. These metrics can in turn be collected and used as a database in trigger expressions.
Automated Configuration
The low-level discovery [7] function is often used to monitor similar entities in the context of a host. It is based on an arbitrary item type that either outputs a specific JSON data structure itself or creates it in preprocessing (e.g., from the results of an API query). Items, triggers, graphs and, if so desired, even hosts can then be generated automatically from these metrics with filters and rules.
Low-level discovery is one of the most comprehensive features in Zabbix. It has been rounded off with increasing numbers of important enhancements in recent releases and forms the basis for dynamic monitoring with little manual intervention. The monitoring templates provided in Zabbix use low-level discovery extensively for automatic detection of filesystems, CPUs, and network interfaces. Advanced monitoring scenarios exist, as well, such as monitoring cloud resources or Kubernetes clusters.
Like all other functions in Zabbix, low-level discovery can be extended widely. It can be used for SNMP-based monitoring, WMI queries on Windows, database queries with ODBC, or custom scripts, among other things.
« Previous 1 2 3 4 Next »
Buy this article as PDF
(incl. VAT)
Buy ADMIN Magazine
Subscribe to our ADMIN Newsletters
Subscribe to our Linux Newsletters
Find Linux and Open Source Jobs
Most Popular
Support Our Work
ADMIN content is made possible with support from readers like you. Please consider contributing when you've found an article to be beneficial.


