Photo by Markus Winkler on Unsplash
A new approach to more attractive histograms in Prometheus
Off the Chart
Prometheus histograms provide a method for displaying the distribution of continuous values. They provide information about the range and shape of the data and are often used to calculate percentiles. To do this, data is divided into 100 distribution areas. The x th percentile is then the value below which x percent of the observations fall.
The classical histogram metric divides a range of values into small sections ("buckets" in Prometheus) and counts the number of observations per area. In classical histograms, you first need to define these areas. Each range is represented by its upper limit. A range of 5s contains the number of all observations with a value less than or equal to five seconds. Besides the ranges, two other values are interesting: the sum total of all observations and the number of observations.
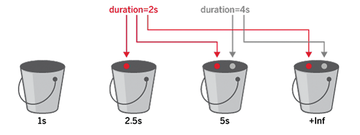
To illustrate, I'll look at a practical example wherein a histogram is defined with three buckets: 1s , 2.5s , and 5s . Two queries, one of which lasts two seconds and the other four seconds, are then observed. The first observation lies within the 2.5s , 5s , and +Inf ranges, and the second lies within the 5s and +Inf ranges (Figure 1). From this data, a histogram of HTTP request duration in seconds can be created in Prometheus (Listing 1).
Listing 1
HTTP Request Duration
# HELP http_request_duration_seconds Histogram of latencies for HTTP requests in seconds.
# TYPE http_request_duration_seconds histogram
http_request_duration_seconds_bucket{le="1"} 0
http_request_duration_seconds_bucket{le="2.5"} 1
http_request_duration_seconds_bucket{le="5"} 2
http_request_duration_seconds_bucket{le="+Inf"} 2
http_request_duration_seconds_sum 6
http_request_duration_seconds_count 2
 Figure 1: The two-second request is assigned to the 2.5s and 5s ranges, and the four-second request is assigned to the 5s and +Inf ranges.
Computing ranges is cumulative. Too many buckets can lead to performance problems. In such a case, you can delete some ranges with metric_relabel_configs while Prometheus is still collecting the values.
Vulnerabilities
Defining range limits is a critical step in classical histograms. The number and size of buckets affect the accuracy of the quantile estimates that can be generated with the histogram. "Quantile" is the generic term for "percentile"; percentiles are the quantiles 0.01 to 0.99 in increments of 0.01.
Ranges that are broken down too finely result in a large number of time series and high memory and disk space use. On the other hand, too coarse a division leads to inaccurate quantile estimates. Finding the balance between the number and size of the domains requires both domain-specific expertise and a good understanding of statistics. In some cases, you might make assumptions that turn out to be unrealistic once your application goes live. Because histograms with different range layouts cannot be merged, changing range boundaries is by no means a trivial task.
The new native histograms make it easier to decide on a range distribution by using a dynamic and adaptive layout. They give you a more accurate representation of the data by independently adjusting the size and number of areas according to the distribution of the data [1].
Another problem with classic histograms is their size and effect on performance. Each area includes a time series that needs indexing and consumes memory; empty areas are always displayed. Additionally, partitioning histograms with multiple labels is ineffective because each label incurs the same amount of overhead, regardless of the number of areas used. For this reason, useful labels such as "error code" are often left out of histograms because each error code value could lead to dozens of new time series.
Native Histograms
Native histograms use an exponential bucket layout with a sparse representation of the data. Empty areas are dropped, reducing memory and disk space overhead. A regular logarithmic range layout with high resolution is used. Also, this type of histogram uses simple ranges instead of cumulative ranges. The application that outputs the histograms determines the schema on the basis of initial hints.
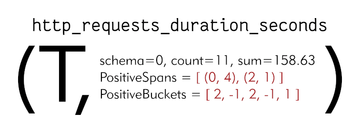
The traditional Prometheus time series database does not allow for a sparse display. A classic histogram typically uses two time series for the number and sum total of values, plus an additional time series per bucket, including the empty areas. As a result, many areas very quickly generate a high level of overhead, which is why the new native histograms are stored differently [2]. The Prometheus time series database stores histograms in a structure that contains all sections and the sum total and count together. The application considers these structures to be unique ("native") objects rather than independent time series (Figure 2). In this way, the time series overhead is incurred only once.
 Figure 2: A native histogram is stored with all areas as a single object. All non-empty areas (and only these) belong to a time series
Reused
For many years, Prometheus used a language- and platform-independent mechanism for serializing data in the form of protocol buffers, known as Protobuf, that relies on a binary format instead of a human-readable text format. Over the years, the text format became the norm, but the complexity of the histograms is bringing Protobuf back into play, because it allows for a very compact representation and makes managing (de)serializing easier. If you enable this option, Prometheus saves all the metrics with Protobuf – if the target supports this format. Metrics can still be collected optionally with tools such as Curl, but doing so forces a return to text format, precluding the use of native histograms.
Buy this article as PDF
(incl. VAT)
Buy ADMIN Magazine
Subscribe to our ADMIN Newsletters
Subscribe to our Linux Newsletters
Find Linux and Open Source Jobs
Most Popular
Support Our Work
ADMIN content is made possible with support from readers like you. Please consider contributing when you've found an article to be beneficial.


