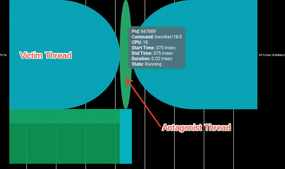
Figure 1

Figure 1: In this example, each horizontal bar represents a core, and the horizontal axis is measured in milliseconds. The blue process, running on one core, has been interrupted by the green process, which briefly swaps the core on which it runs.