
Lead Image © Lucy Baldwin, 123RF.com
Measuring the performance of code
Punching the Clock
As soon as your code starts working, and perhaps even before it does, the engineer's brain naturally drifts toward making it faster. These brave thoughts are premature if the program's architecture is not yet fully settled, but once it is, the critical question becomes just how fast a segment of code runs. Measurement is critical to figuring out what part of the code is just not running fast enough for the program's aims.
Crawling Python
The timeit [1] module provides a simple way to measure the performance of short code segments. Including both callable and command-line interfaces, timeit is the first stop for most users when it comes to measuring the speed of Python code. Figure 1 shows timeit in use in an interactive Python environment, comparing the performance of the round implementations found in the standard Python built-ins [2] and in the NumPy library [3].
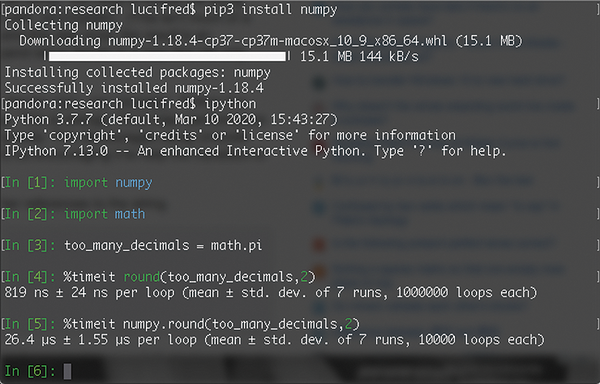 Figure 1: IPython session comparing two implementations of a round routine.
Unless you specify otherwise, timeit automatically selects the appropriate number of tests to
Buy this article as PDF
(incl. VAT)
Buy ADMIN Magazine
Related content
-
Determining CPU Utilization

CPU utilization metrics tell you how well your applications are using your processing resources.
-
Thrashing the data cache for fun and profit
 To reduce the possibility of disk thrashing, optimize your data cache through spatial locality and cache-friendly algorithms and utilize fully the data loaded from slower storage media before moving on.
 -
Getting the most from your cores
 CPU utilization metrics tell you how well your applications are using your processing resources.
 -
System temperature as a dimension of performance
 Sensor tools can provide highly variable data from CPUs, GPUs, and a variety of sources. We look at some tools to verify the temperature of components on diverse hardware.
 -
Bottom: The new top
 Bottom is the latest process and system monitoring terminal user interface tool, delivering lightweight but beautiful monitoring.