
Lead Image © Maxim Kazmin, 123RF.com
Visualizing time series data
Painting by Numbers
Graphite [1] is hierarchically structured, real-time graphing system (Figure 1). A client collects data from the source, and a Graphite daemon (Carbon [2]) on TCP port 2003 receives the data and stores it in a round-robin database named Whisper.
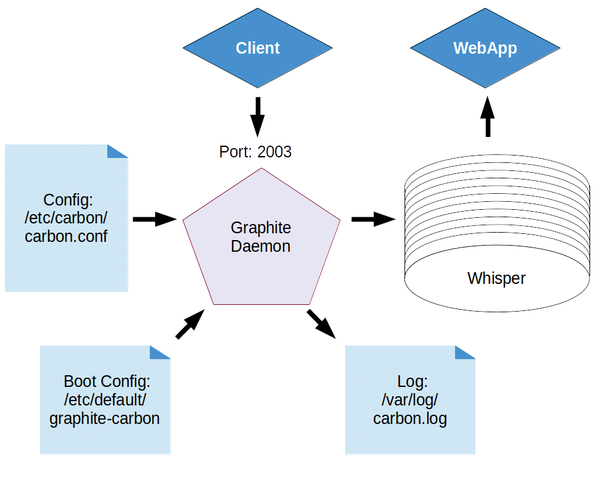 Figure 1: Graphite is hierarchically structured; various components must play together.
A web application then grabs the data from this database and creates charts. The client can be programmed by the user or it can come as a prepared daemon (e.g., collectd [3]). If you like to measure your own applications, you can send performance data to a client like statsd [4].
Installation
The easiest way to install Graphite is from the package repository of your distribution. Graphite is available in some of the latest distributions, like Fedora 20 or Ubuntu 14.04 LTS. You can also find ready-made images for a virtualization solution like Docker. A simple docker graphite search shows a number of Graphite images.
Of course, you can also install Graphite from the Git
...Buy this article as PDF
(incl. VAT)
Buy ADMIN Magazine
US / Canada
UK / Australia
Related content
-
Graphite: Collect and Visualize Numeric Data

Graphite converts confusing columns of time series data into handy diagrams, showing trends in operating system and application metrics at a glance.
-
Real-time monitoring with Graphite
 The open source Graphite tool offers real-time monitoring for IT environments, with comprehensive and fast data collection from virtually any system.
 -
Proactive Monitoring
 System administrators usually take action after monitoring software indicates the failure of a service or server. In contrast to this reactive approach, a proactive monitoring solution with Riemann allows admins to detect problems in advance.
 -
Monitoring with collectd 4.3
 Collectd 4.3 is a comprehensive monitoring tool with a removable plugin architecture.
Subscribe to our ADMIN Newsletters
Subscribe to our Linux Newsletters
Find Linux and Open Source Jobs
Most Popular
Support Our Work
ADMIN content is made possible with support from readers like you. Please consider contributing when you've found an article to be beneficial.
