
Text-based user interface tools for a development container.
TUI Tools for Containers
In the last article about creating a container for a development environment with HPC Container Maker (HPCCM), I didn’t talk about how to install editors or integrated development environments (IDEs). From my experience, I had a couple of thoughts about editors in the container, but I didn’t include them in the article, so in this article, I want to talk about some of the tools that can be used.
To begin, I don’t want to put GUI tools in the container, so I don’t have to tunnel to the host, can keep the container much smaller, and can reduce the number of applications in the container. These conditions point toward text-based user interface (TUI) tools.
The specific tools that can be used are text editors or IDEs and some monitoring tools for the container. I don’t use IDEs, so I will just use a text editor in one terminal, the command-line interface (CLI) for the compilers in a second terminal, and a monitoring tool in a third terminal to watch for possible issues.
I’ve written about TUIs in the past, but it’s been a while, so I searched for TUI applications, particularly text editors and monitoring tools. I found some new ones and some old ones that I wasn’t aware of. In this article, I won’t write about all of them because there are too many, but I will focus on a few categories. I’ll write about TUI editors first, and then pivot to monitoring tools.
TUI Editors
I use GUI editors when not using containers, so I’m interested in TUI-based editors rather than CLI editors. To give you an idea of what I mean, I will demonstrate my age by mentioning Turbo Pascal or Turbo C from Borland. These were really IDEs, but they both used a TUI.
As a quick aside, you should know about CLI editor such as Vim and Emacs because they can save your veggie-based bacon on occasion when all you have is a small text-based terminal to your system.
The one TUI editor I want to mention is Tilde. It works like GUI editors, with pull-down menus at the top and common key bindings (e.g., Ctrl+C, Ctrl+V). Figure 1 shows some old Fortran77 code that I pulled up in Tilde.
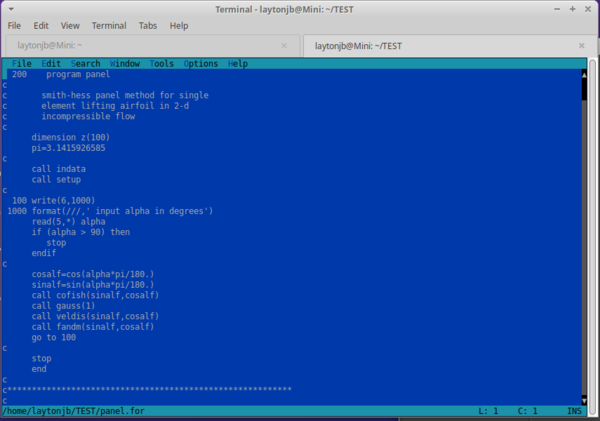 Figure 1: Tilde with old Fortran77 code.
I used Tilde for a few days writing text and code, including porting the Fortran77 code to Fortran 90, and I found it very comfortable to use. I only had to resort to the Help one time (a record for me). Initially I wasn’t a big fan of the default colors, but I got used to them very quickly. Honestly, I really liked Tilde and I might use it more in the future.
On the other hand, I missed not having tabs so I could open more than one file in the editor instance, although it is not something I require. However, I really missed not having line numbers, especially if the file is long. Multiple requests have been made for line numbers, and the original author of Tilde threw out some basic steps that need to be accomplished, but no one, including the author, has implemented them. I’m thinking very hard about finding a way to fund someone to add line numbers.
I looked at several other TUI text editors, but in my opinion, none of them were as good as Tilde. Overall, if a container is used as a development environment and you want the editor to be in the container, Tilde is very good editor.
Monitoring Tools – Dashboards
While perhaps not overly necessary, having TUI-based monitoring tools in a development container can help you determine whether you have problems. Generally, these monitoring tools are referred to as “dashboards,” when in essence they are really top-like tools (i.e., tools that work like the Linux command top).
These tools are useful when using a container as a development environment, because if you have problems with something in the container, you have a terminal open into the container to which you can quickly switch and investigate.
Several top-like text-based tools can be found, and interestingly, some of them have ASCII plotting or data visualization capabilities. Granted, their resolution isn’t as high as GUI-based charts, but you can still use them to great effect for overall trends.
top-Like Tools
More of these tools are around than you might think – as well as libraries you can use to build your own. The ones I want to feature include:
I admit, my favorite from the list is bashtop. Because it presents more information than top, you don’t have to use several tools to get that “one pane of glass” look.
Bashtop has tons of nice features:
- It allows you to reconfigure the various panes on the fly.
- It has mouse support.
- It has some data visualization capability, so you can get a time history of various metrics.
- It is themeable.
For me, perhaps the best cool bashtop factor is that it is written 100% in bash. The screenshot in Figure 2 shows bashtop running on my host system.
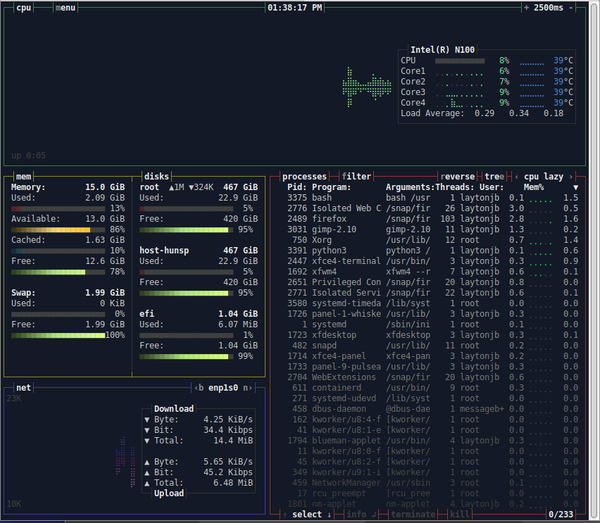 Figure 2: Bashtop.
The chart at the top-right presents the load averages and temperatures for the cores. As you look around, you can see other metrics such as memory, disk, and network utilization, along with an enhanced process table that includes memory and CPU usage. Notice that the network information at lower left has a chart, like the core utilization in the upper right, that shows network data rates into and out of the system.
After writing bashtop, the author went on to write bpytop, which is basically the same but uses Python. Next, they wrote Btop++ or just btop, which is written in C++ but, again, is basically the same as bashtop. I still prefer bashtop and use it often.
More Data Visualization
For something a bit more graphical, two other TUI tools, bottom and gotop, are top-like tools that provide more time histories than others. The first option, bottom, is somewhat like bashtop, but offers a very nice charting capability that I really like (Figure 3).
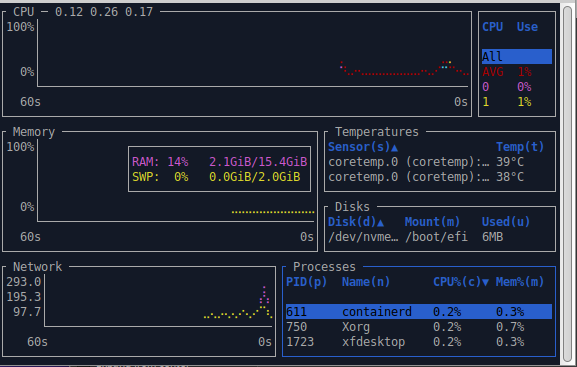 Figure 3: bottom.
To me, the layout is a little cleaner than bashtop. The default configuration shows three horizontal strips. The top strip has a plot of the time history of the overall CPU load, and to the right in a box are instantaneous and one-minute CPU usage.
The second strip is a time history of memory usage, including a separate box of color-coded memory and swap usage (yes, I still have a swap space). To the right are the two core temperatures of the system with the basic disk usage below it. Finally, the bottom strip has a real-time chart of network usage for both data in and data out of the system. The list to the right has the top processes with their CPU and memory usage.
Overall, bottom presents a nice visual glance as to the status of your system and includes some nice time histories. It would be an excellent tool to include in a container to watch for issues.
The next top-like tool is written in Go, but to me, gotop really emphasizes ASCII charts more than other tools (Figure 4). The time history charts for CPU usage, including each core in this case, appear at the top. Below that are the time histories for memory usage and swap and for network data received (Rx) and data transmitted (Tx), including their rates. Data presentation as time histories can be really useful for getting a quick overall status of the host system.
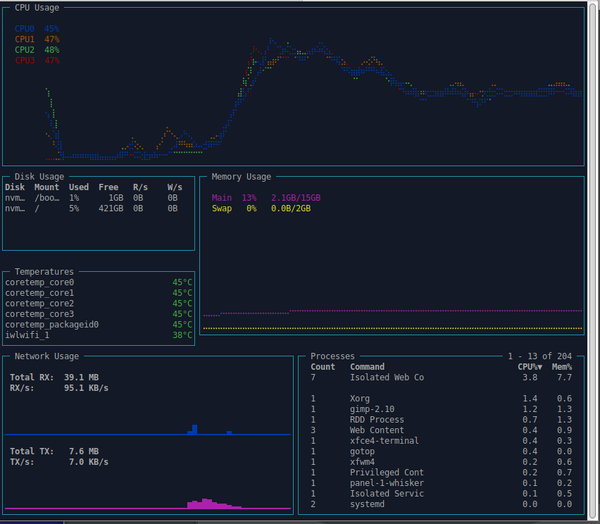 Figure 4: gotop.
Also in the lower panes of gotop, you’ll find tables of information for disk usage, including partitions, and the CPU and core temperatures. In the bottom right, a process table shows the percent CPU and memory usage with the processes ranked by CPU usage.
Summary
After considering containers and their roles in HPC, I started wondering about including dev tools in development containers. The idea is to run a container interactively but have a few terminals open to the running container. In one terminal I would edit the files, and in a second terminal I would compile or test. A third terminal could have a system monitoring tool in case something goes sideways in the container. Overall, I wanted to do this without a GUI interface because I’m curious about whether TUI tools can be used.
I found several TUI text editors for Linux, but to be honest, the only one I considered was Tilde because of its ease of use. Perhaps this betrays my ASCII background when the dinosaurs ruled the earth, but Tilde felt comfortable, with no learning curve. It checked all of my boxes for a good text editor except one: It does not have line numbers, which I find invaluable, especially when the file is large. Although I think this deficiency might be a deal breaker, I'm going to continue to use Tilde in some capacity. I’m begging the world for a hero to step up and add line numbering to Tilde.
Next, I looked at TUI-based monitoring tools, which ultimately resulted in a fairly long list of top-like tools; however, I downselected to a few and ended up choosing three (bashtop, bottom, gotop) that I would use in a development container. These outstanding text-based tools offer your system status at a glance. Each tool provides information on various aspects of the system (i.e., the container), including some real-time histories in ASCII charts.
Overall, development containers with TUI tools is possible, but the editor aspect leaves it a bit rough around the edges. I still love the idea, but maybe it’s not quite ready for prime time.