« Previous 1 2 3 4 Next »
Manage cluster state with Ceph dashboard
Not Just a Pretty Face
Creating Graphics with Grafana
In terms of the dashboard, the Ceph developers didn't start from nothing. Instead they rely on existing functionality. The Ceph Manager daemon also rolls out several Docker containers along with the Ceph dashboard: one for the Prometheus time series database and one for Grafana.
Ceph has its own interface that outputs metrics data in a Prometheus-compatible format. The Prometheus container rolled out by the Ceph Manager daemon taps into this, and the Grafana container, also rolled out, then draws graphics from these metrics on the basis of preset values. The dashboard ultimately embeds the graphics from Grafana with an iFrame, and the drawing job is done. In any case, you shouldn't panic if you suddenly find Docker instances running on your Ceph hosts – that's quite normal. More than that, the latest trend is, after all, to roll out Ceph itself in a containerized form. Consequently, not only do Prometheus and Grafana run on the servers but so do the containers for MONs, OSDs, and the other Ceph services.
The original focus of the dashboard was to display various details relating to the Ceph cluster. In recent years, however, this focus has shifted. Today, the dashboard also needs to support basic tasks relating to cluster maintenance, facilitated by levers and switches in various places on the dashboard that can be used to influence the state of the cluster actively, as the next section demonstrates.
Creating OSDs, Adding Storage Pools
Consider a situation in which you want to scale a cluster horizontally – a task that Ceph can easily handle. The first step (at least for now) is to go back to the command line to integrate the host into Ceph's own orchestration. On a system where Ceph is already running, the command
ceph orch host add <hostname>
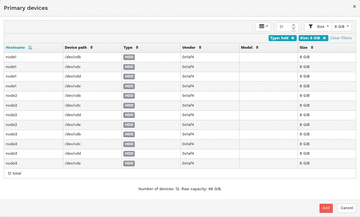
will work. The host will now show up on the dashboard, along with a list of storage devices that can become OSDs. In the next step, you then add the OSDs to the cluster from the Cluster | OSDs menu. To do this, select the devices on each host that will become OSDs (Figure 3) and confirm the selection. The remaining background work is again taken care of by the Ceph Manager daemon.
 Figure 3: The dashboard is no longer considered just a graphical view but also an admin tool, as seen here when creating OSDs.
Unlike creating OSDs, you do not need to add hardware when creating a pool in Ceph. You can add an additional pool to the existing storage at any time; likewise, you can remove existing pools at any time from the previously mentioned Pools menu in the left overview menu.
Displaying Logs
Anyone who deals with scalable software will be familiar with the problem that, in the worst case, an error on one host is directly related to an error on another host. To follow the thread of error messages, you comb through the various logfiles on the different systems one by one, moving from one file to the next, a tedious and time-consuming effort. In large environments, it is therefore normal to collect logfiles centrally, index them, and so make them searchable.
The Ceph dashboard at least implements a small subset of this functionality. In the Cluster | Logs menu item you will find the log messages from the various daemons involved in the cluster, as well as status messages from Ceph itself. Here you can efficiently search for an error message without having to go through all the servers in your setup.
« Previous 1 2 3 4 Next »
Buy this article as PDF
(incl. VAT)
Buy ADMIN Magazine
Subscribe to our ADMIN Newsletters
Subscribe to our Linux Newsletters
Find Linux and Open Source Jobs
Most Popular
Support Our Work
ADMIN content is made possible with support from readers like you. Please consider contributing when you've found an article to be beneficial.


