« Previous 1 2 3
Sustainable Kubernetes with Project Kepler
Power Play
Installing Kepler
To install Kepler on your Kubernetes cluster, first clone its repo to the same workstation you use to manage the Kubernetes cluster:
git clone https://github.com/sustainable-computing-io/kepler.git
Next, cd into the kepler directory and build the Kubernetes manifest for your Kepler deployment:
make build-manifest OPTS="BM_DEPLOY PROMETHEUS_DEPLOY"
For this test, specify the BM_DEPLOY option (which tells Kepler that you're running on a bare metal host and therefore it should not try any of the "estimation" that it would attempt on a hypervisor) and the PROMETHEUS_DEPLOY option (which tells Kepler to create Role, RoleBinding, and ServiceMonitor objects for Prometheus). These options configure Prometheus to scrape metrics from the kepler-exporter pods and give it the permissions it needs to do so. The usage scenarios on the Kepler website [5] show the differences between the various model components and, in particular, how the ML model component gets deployed from a pre-trained model with fixed weights, right through to a standalone model server that continues re-training throughout the life of the Kepler deployment. Kepler's ML model for power estimation is a seperate GitHub project in its own right and beyond the scope of this article, but by browsing the Kepler power model docs online [6], you can see the different features used for training the model to understand the factors that influence Kepler's output.
Now open the manifest (_output/generated-manifests/deployment.yaml) generated by the make command to get a clear idea of the objects it creates on your cluster – in particular, the kepler-cfm config map. The config map is used to set the ML model configuration and to enable or disable various metric groups, which is something you might want to do depending on the capabilities of your processor, kernel, and hardware. You can edit deployment.yaml to make any other desired changes at this point (e.g., you could increase the debug level). When done, apply the manifest:
kubectl apply -f _output/generated-manifests/deployment.yaml
After the Kepler pods come to Ready state, check their logs to see if they were able to deploy the eBPF program and interface with RAPL and to see what kind of power estimation will be used. The logs also indicate whether a GPU was found, along with the ACPI availability on the host. If Kepler was unable to find any source of hardware power information or unable to launch its eBPF program to query the kernel's performance counters, it will clearly say so in the pod logs; however, the lack of these seemingly necessary sources of information won't prevent the pod from coming to Ready state, which is something you definitely want to know. Therefore, I'd strongly recommend checking the logs of each host's kepler-exporter pod the first time you run it, to see whether Kepler is able to query legitimate information sources from that host or not. You'll definitely need to install kernel headers on your hosts for the eBPF program to work:
kubectl logs -n kepler ds/kepler-exporter
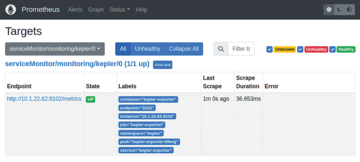
Now connect to the Prometheus web UI and verify that the ServiceMonitor configuration has been loaded by searching for kepler under Status | Configuration . Check Status | Targets to make sure you see one entry for each node under serviceMonitor/monitoring/kepler and that the entries are in a green state, as shown in Figure 6.
 Figure 6: The Prometheus Targets window shows that serviceMonitor/monitoring/kepler is in the UP state when Prometheus can successfully scrape metrics from the Kepler exporter pods.
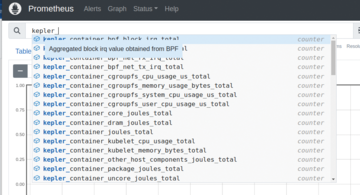
Next, type kepler into the query browser on the Prometheus homepage to see the complete list of metrics exported by Kepler. You should see a list similar to that shown in Figure 7, and they are all interesting to explore; those of main concern for this article refer to containers and joules (e.g., kepler_container_core_joules_total , a counter for the number of joules consumed by CPU cores, grouped by container ID).
 Figure 7: Kepler exports a variety of metrics showing per-pod and per-node energy consumption broken down into CPU (core, non-core, and package) and DRAM.
To derive power from any of Kepler's joule counters, you need to query them with the built-in PromQL irate function, which returns the per-second increase in the number of joules used (i.e., watts).
Now that you can see Kepler's metrics in Prometheus, you can repeat the controlled workload experiment used with the smart switches earlier. You should expect Kepler to report that the test workload's bubblesort pod consumes an amount of energy roughly equal to the power consumption bump reported by the metrics of the ESPHome power switch. Luckily, Kepler comes with a ready-made Grafana dashboard, so you don't need to figure out the correct irate query.
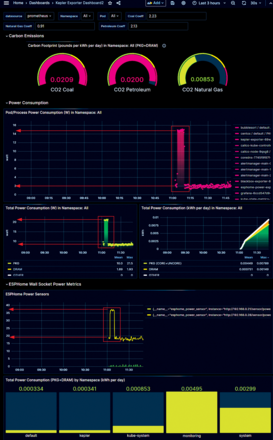
Next, connect back to the Grafana UI of the Prometheus installation (set up earlier in the article) and, under the Dashboards page, upload the Keper-Exporter.json dashboard in the grafana-dashboards folder of the cloned kepler directory. My modified version, shown in Figure 8 (workload on the Haswell node, comparable to Figure 3) and Figure 9 (on the Skylake node, comparable to Figure 4), also includes a dashboard of metrics from my smart switches – the same information as shown in Figures 2 and 3. You can find this complete dashboard in my GitHub repo [4], which allows you to correlate easily the total mains power increase (monitored by the smart switch) with the power usage that Kepler reports for the test workload pod. With the dashboard uploaded and set to auto-update, you can rerun the bubblesort workload and see what Kepler makes of it.
 Figure 8: Kepler's Grafana dashboard shows that Kepler has detected the power increase caused by the test bubblesort workload on the Haswell node.
Figures 7 and 8 show that the total pod and host power consumption reported by Kepler ties in quite well with the consumption reported by the Sonoff smart switches. Therefore, you can trust Kepler's results for these particular metrics in other hosts whose mains power consumption you can't measure directly. However, what I couldn't find a good explanation for is why (when isolating a single pod in the Pod/Process Power Consumption dashboard) Kepler would seemingly apportion the increased power draw from the test workload across all
the pods, because there's no reason why running the bubblesort workload in the default namespace should cause a corresponding uptick in the power consumed by, say, the coredns pods, which have nothing to do with this workload. This is why you see the "histogram" effect in the Pod/Process power chart in Figure 9. I suspect it's something to do with Kepler's Power Ratio methodology. In Kepler's deployment.yaml manifest, the ENABLE_PROCESS_METRICS setting is always set to false by the build process; setting it to true caused the Kepler exporter pod to crash in every environment I tested, but with error messages that hint at more pod-specific power consumption results than are currently being generated. I'm still exploring this within the open source project in the hope that the option can be made to work.
Comparing Carbon Footprints
Eye-catching dashboards and detailed metrics are great for satisfying your intellectual curiosity, but they aren't of much practical use if you can't translate them into real energy savings. Without any additional work, you can use the dashboards shown above to test and compare the carbon footprints of different pods, providing you can run those tests in a controlled environment. This could be beneficial when trying to work out the most energy efficient option from a range of possible solutions in a project.
Projects are underway to leverage Kepler's metrics in an automated fashion. The Power Efficiency Aware Kubernetes Scheduler (PEAKS) uses Kepler's exported metrics in a Kubernetes scheduler designed to place pods on the most energy-efficient nodes (e.g., in a distributed cluster or one whose nodes use different energy tariffs at different times of day). The Container Level Energy-efficient VPA Recommender (CLEVER) uses Kepler metrics to recommend Vertical Pod Autoscaler resource profiles to improve energy efficiency by running workloads. (The idea being that a pod's resource requests and limits can be tuned for an optimal ratio of computational work rate to energy consumption.) Both of these projects are available under Kepler's repo [3].
Conclusion
For much of my career, environmental considerations have always seemed like a problem for other industries. However, it's becoming clear that each of us has a responsibility to consider the sustainability of everything we do and every project we bring into the world. In aiming to provide pod-level power metrics and carbon footprint data, Project Kepler has taken on a complex but valuable task. It's certainly worth watching as it makes rapid progress from its current CNCF Sandbox status, if all goes well.
Infos
- Energy consumption by data centers: https://www.techtarget.com/searchdatacenter/tip/How-much-energy-do-data-centers-consume
- Kepler: https://sustainable-computing.io/
- Prometheus operator for Kubernetes: https://github.com/prometheus-operator/prometheus-operator/tree/main
- Prometheus-compatible metrics example: https://github.com/datadoc24/kubernetes-power-monitoring/wiki/Scraping-Sonoff-S31-ESPHome-power-sensor-metrics-into-Prometheus-and-Grafana-on-K8S
- Kepler power model: https://sustainable-computing.io/design/power_model/
- Kepler model server: https://github.com/sustainable-computing-io/kepler-model-server/
« Previous 1 2 3
Buy this article as PDF
(incl. VAT)
Buy ADMIN Magazine
Subscribe to our ADMIN Newsletters
Subscribe to our Linux Newsletters
Find Linux and Open Source Jobs
Most Popular
Support Our Work
ADMIN content is made possible with support from readers like you. Please consider contributing when you've found an article to be beneficial.


