« Previous 1 2 3 4 Next »
Manage cluster state with Ceph dashboard
Not Just a Pretty Face
Dashboard Overview
Because the dashboard has seen many new features over the past few years, it can be a little difficult to get started. It won't hurt to familiarize yourself with the various menu items after the initial dashboard login. A key new feature in the Octopus release of Ceph was the introduction of the navigation bar on the left side of the screen. This feature helps with organization because it divides the most important menu items into clusters and displays them coherently.
The Cluster item (Figure 1), for example, hides entries that refer to the components of the RADOS object storage, including the MON and OSD services; all disks used; the logfiles generated by the services; and the configuration of the Ceph Manager daemon component. Additionally, it will also give you some insight into the continuous replication under scalable hashing (CRUSH) map, which describes the algorithm Ceph uses to distribute data to the available disks on the basis of specific rules and creates replicas of the disks. The CRUSH map lets you determine which logical structure the cluster follows (i.e., which hard drives belong to which servers, which servers belong to which firewall zones, etc.).
Navigating to the Pools entry in the side menu on the left takes you to the setup of pools. They are a kind of logical division: Each binary object in the Ceph cluster belongs to a pool. Pools act kind of like name tags; they also allow Ceph to implement much of its internal replication logic. In fact, it is not the objects that belong to a pool but the placement groups. A pool is therefore always a specific set of placement groups with a defined number of objects. By creating, deleting, and configuring pools, which is possible from this entry in the dashboard, you can define several details of the cluster, including the total number of placement groups available, which affects the performance of the storage, as well as the number of replicas per pool.
Menu Settings
The next set of menu items deals with the front ends for Ceph that the user needs for access. Under Block , you can access an overview of the configured virtual RADOS block devices (RBDs), although this is more for statistical purposes because RBD volumes are usually set up autonomously within the framework of their specifications without you having to do anything with them. Similar restrictions apply to the menu items NFS and Filesystems , which provide insights into the statistics relating to Ganesha, a userspace NFS server, and CephFS, a POSIX-compliant filesystem built on top of RADOS. Here, too, you will tend to just watch rather than touch.
The Object Gateway item, on the other hand, allows a bit more interaction. Here, you can access the configuration of the Ceph Object Gateway, which is probably still known to many admins under its old name, RADOS Object Gateway (RGW). Depending on the deployment scenario, the object gateway comes with its own user database, which you can influence through the menu.
You can see the current status of the cluster in the dashboard. You can also handle a large number of basic maintenance tasks without having to delve into the depths of the command line and the ceph tool. Because Ceph has gained more and more functions in recent years, its commands have also had to become more comprehensive. Newcomers might find it difficult to make sense of the individual commands that Ceph now handles. The dashboard provides a much-needed bridge for the most basic tasks.
Monitoring Hard Disks
Although most administrators today want a flash-only world for their storage, this is not yet the reality in most setups. If you want a large amount of mass storage, you will still find a lot of spinning metal. In the experience of most IT professionals, these are the components most likely to fail. Anyone running a Ceph cluster with many hard disks will therefore be confronted with the fact that hard drives break down sooner or later.
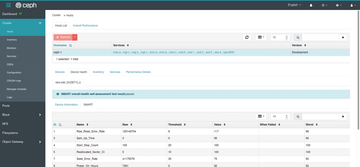
The dashboard helps you in several places. Although the self-monitoring, analysis, and reporting technology (S.M.A.R.T.) does not work 100 percent for all devices, certain trends can be read from the disks' self-monitoring. For this reason, the developers of the Ceph dashboard integrate S.M.A.R.T. data into the GUI and prominently display any of its warnings in the dashboard. You can access the overview by first selecting the respective host and the respective disk and then clicking on SMART in the Device health tab (Figure 2).
 Figure 2: Ceph can read S.M.A.R.T. information from recent devices and, if necessary, issue an alert, which the dashboard then displays.
S.M.A.R.T. information is immediately recognizable in another place in the dashboard: If a hard disk is in a questionable state of health according to the S.M.A.R.T. information, Ceph evaluates the data in the background and outputs a corresponding warning. This information appears prominently on the start page in the Cluster Health section. By the way, you can get the same output at the command line by typing ceph -w or ceph health.
« Previous 1 2 3 4 Next »
Buy this article as PDF
(incl. VAT)
Buy ADMIN Magazine
Subscribe to our ADMIN Newsletters
Subscribe to our Linux Newsletters
Find Linux and Open Source Jobs
Most Popular
Support Our Work
ADMIN content is made possible with support from readers like you. Please consider contributing when you've found an article to be beneficial.


